Several figures point towards a lack of optimism in the economy. Firstly, the government believes that GDP, in nominal terms, will grow 10% during fiscal year 2027 (FY27), the lowest budget projection since the pandemic-hit FY21. While this will be better than the 8% growth estimated in FY26, the truth is that a large part of this increase could simply be attributed to inflation climbing back to normal from ultra-low levels.
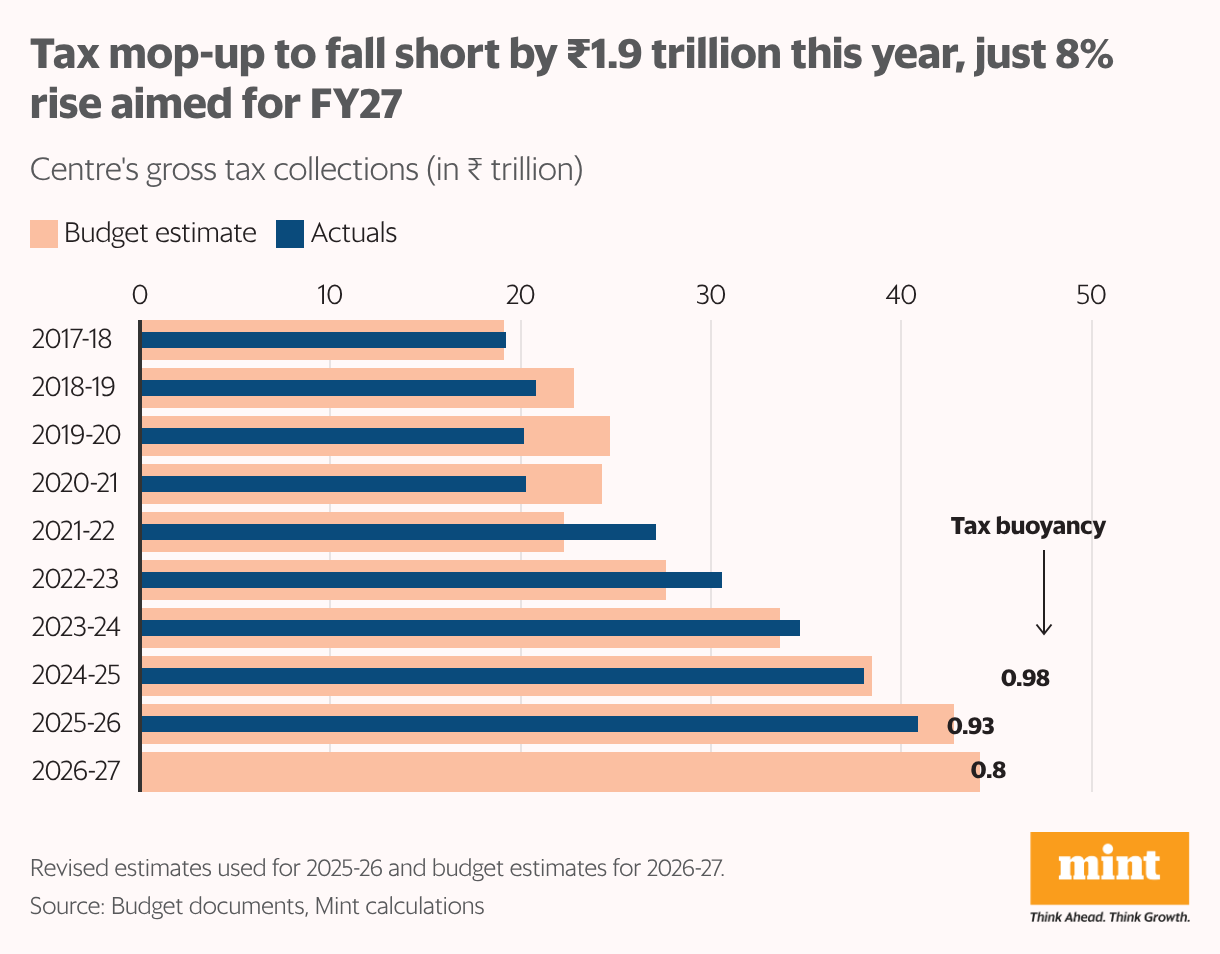
Secondly, the Centre’s tax collections are expected to grow by just 8%. The crucial goods and services tax (GST) component is, in fact, estimated to shrink, signalling a lack of momentum in consumption.
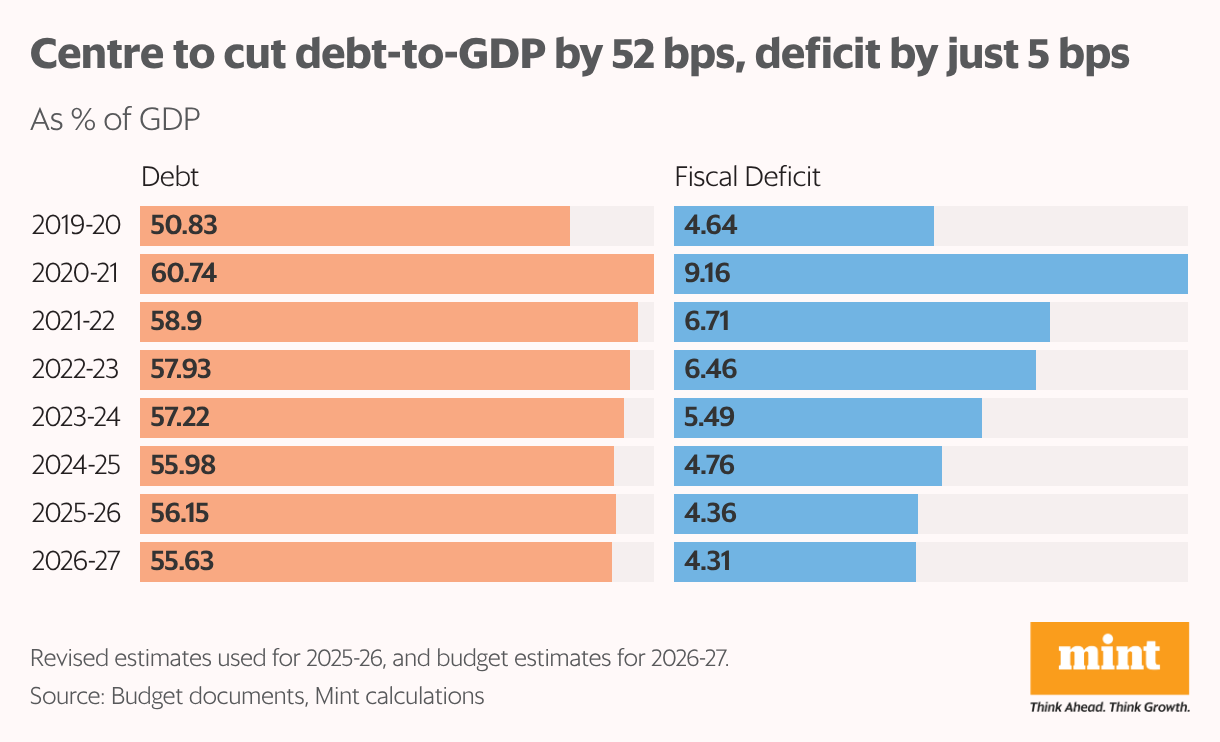
Thirdly, despite non-tax revenue continuing to act as a cushion, fiscal consolidation will slow down significantly. Starting this year, the Centre’s fiscal north star is the debt-to-GDP ratio, which it aims to cut by 52 basis points (bps) to 55.63% in FY27. That is nearly half the rate of around 100 bps reduction needed each year to reach the 50% target by 2031. While there’s ample time to pace this up in the coming years, the start has clearly been slow.
Meanwhile, the traditional measure of fiscal health—fiscal deficit as a percentage of GDP—is set to go down by just 5 bps to 4.31%. Economists had hoped for a 20-30 bps reduction.
After expanding the budget during the pandemic, the government had embarked upon a rapid fiscal consolidation path, reducing the fiscal deficit from 9.2% of GDP in FY21 to 4.4% by FY26 (it had committed to bring it below 4.5% by this year). This came largely on the back of a sharp reduction in revenue expenditure, while capital expenditure witnessed a sharp uptick.
In FY27, the good news is that the government has stayed steady on its capital expenditure commitment, which is likely to have a multiplier effect on other sections of the economy. But the revenue hit from tax cuts has constrained the government’s ability to manage more wondrous levels of deficit reduction.
Taxing times
The government’s bet on back-to-back tax cuts in 2025 led to a massive shortfall in FY26—it now expects to miss its initial goal by 4.5% ( ₹1.9 trillion in absolute terms). The income tax component will fall short by 8.8% despite its impact being accounted for in the previous Budget, and the GST mop-up (which was announced mid-year) will be lower by 11.1%.
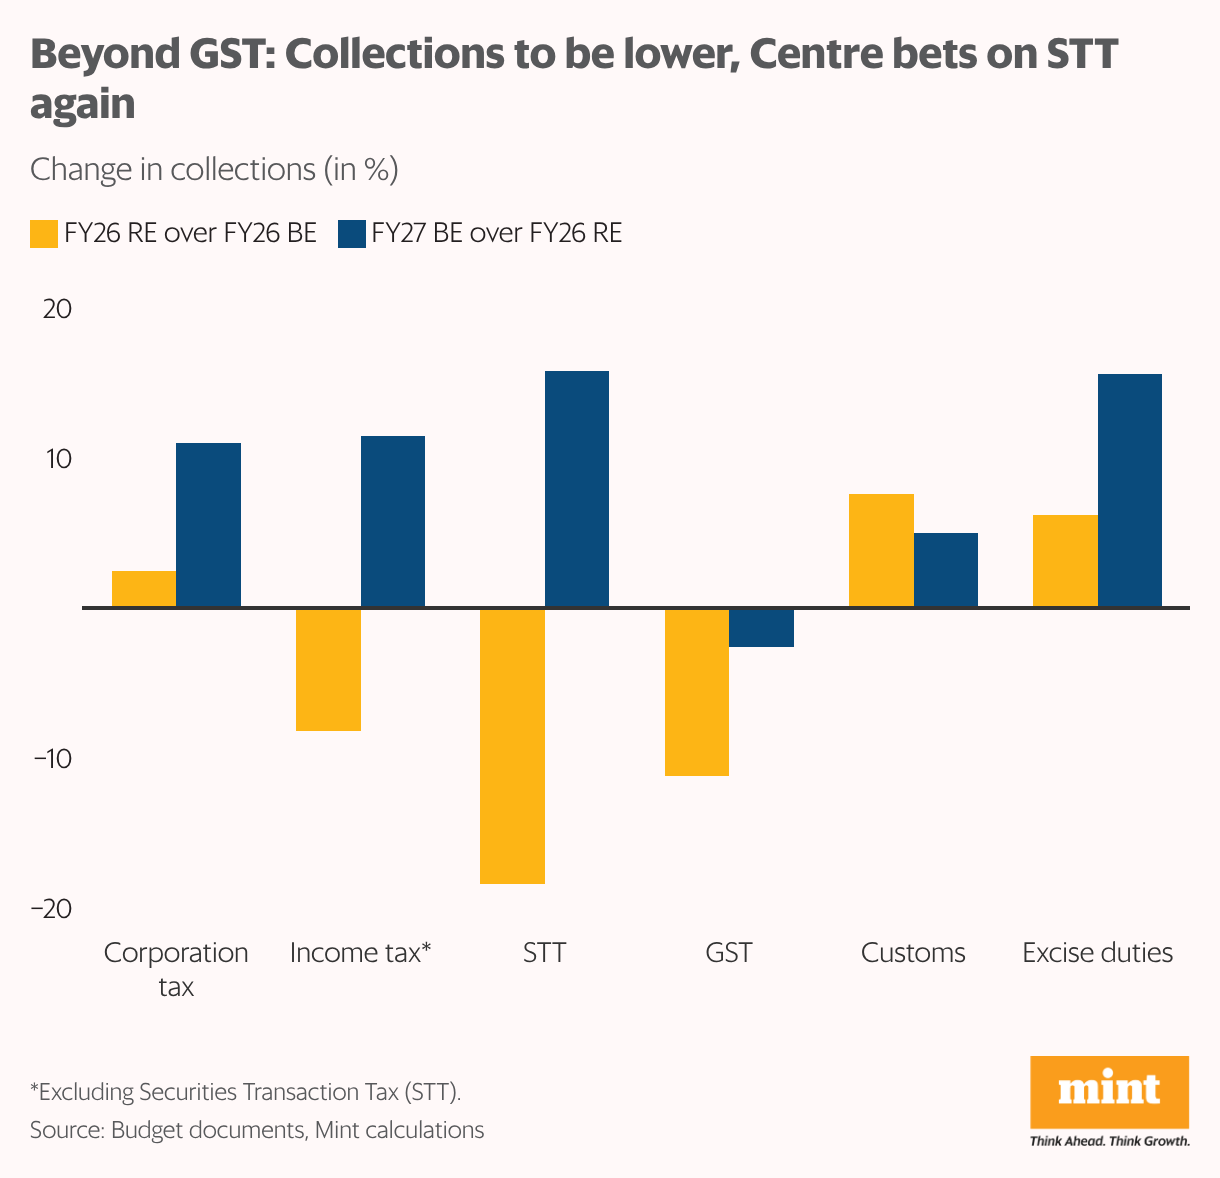
Income tax collections are now expected to revert to an 11.5% growth rate, but that’s modest compared to the average 21% increase seen between FY23 and FY25. GST collections will fare worse: they are set to decline further by 2.6%, going against the hope that last year’s historic rationalization in the tax rate structure would boost consumption, and in turn, lead to higher mop-up. The third major component, corporate tax collections, is expected to grow 12.3% in FY26, which will slow to 11.0% in FY27.
On the bright side, the government has placed heavy emphasis—once again—on collections from securities transaction tax (STT), perhaps expecting higher revenue coming in from the hike it has announced in rates on futures to 0.05% from 0.02% and on options to 0.15% from 0.1%.
The STT collections are expected to grow 15.8% in FY27, even as the FY26 target was missed by a large margin. Even the revised estimate for FY26— ₹63,670 crore—looks optimistic. Until December, the government had collected only ₹40,220 crore. So, going by the trend in the first nine months of the fiscal year, the collections should end up at around only about ₹54,000 crore.
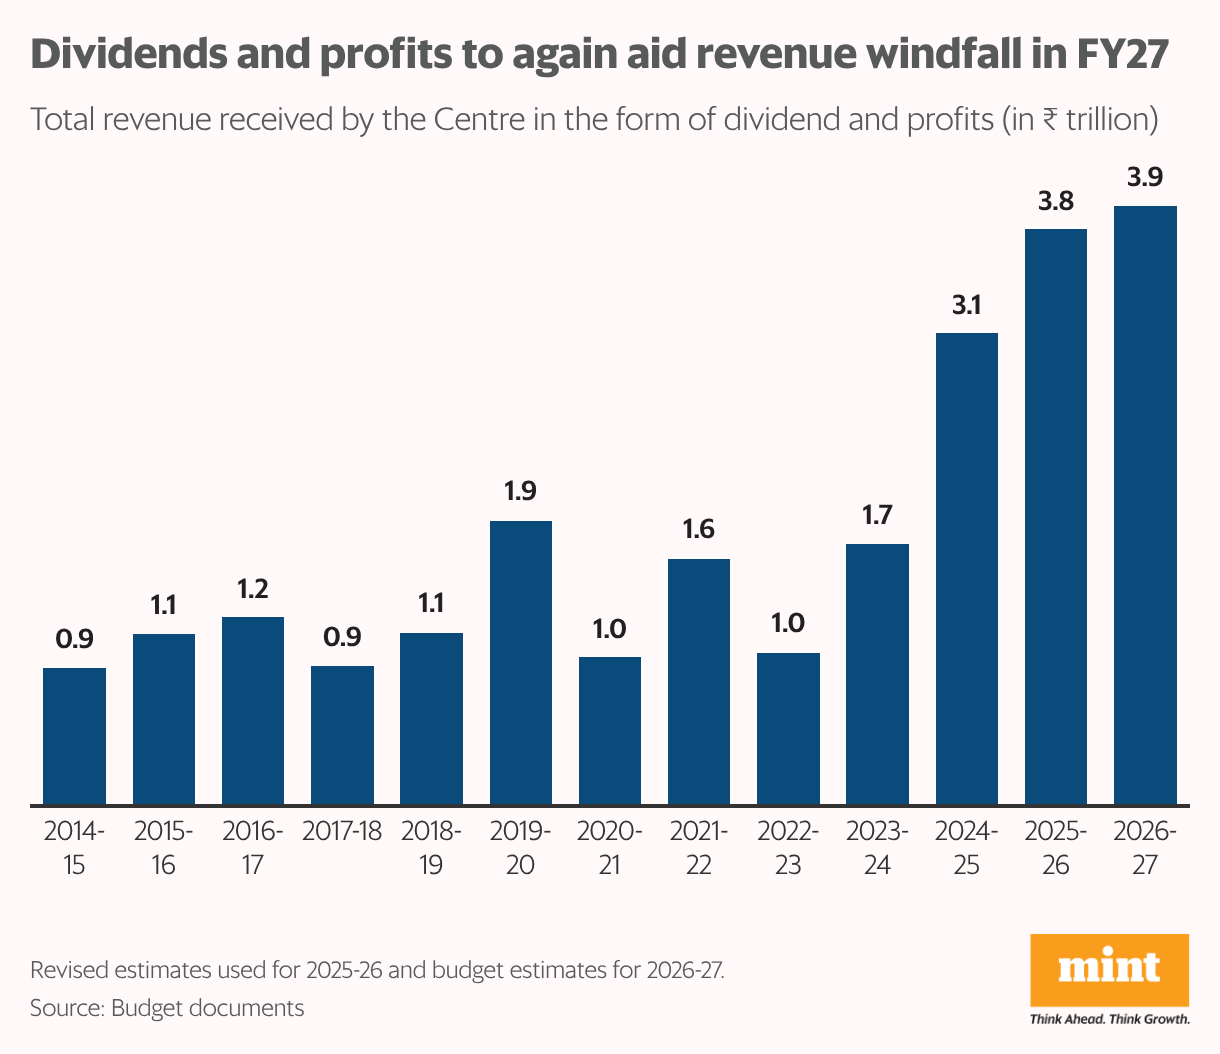
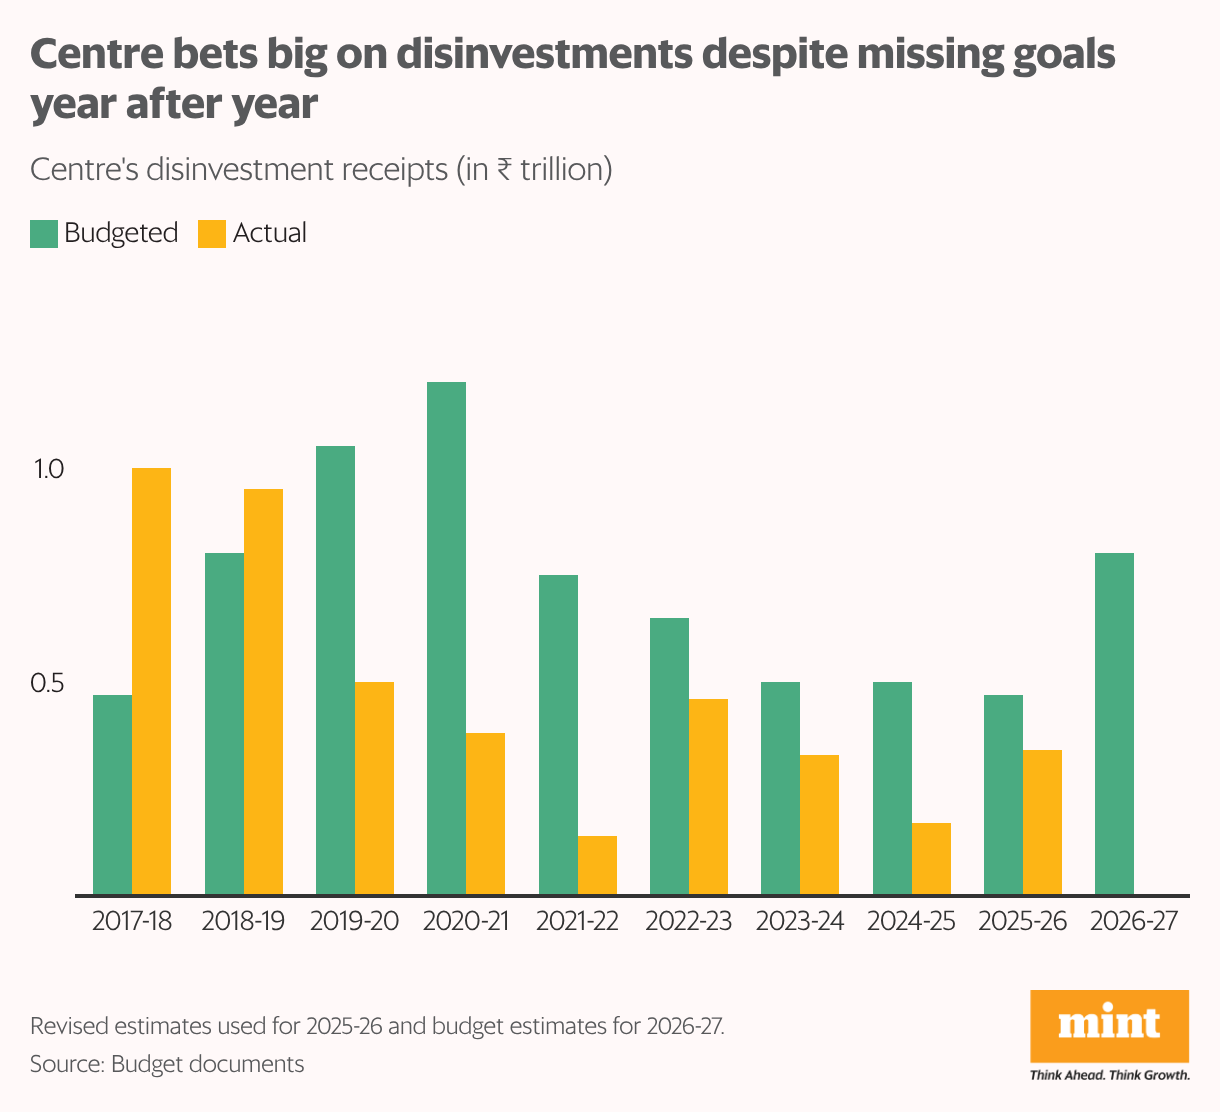
Optimism seems to have returned for disinvestments, too. The government has doubled the disinvestment revenue estimate to ₹80,000 crore in FY27 despite being on track to miss its FY26 target by 28%. Next year’s target, though, may be higher thanks to deals stuck in the pipeline and the expectations that they will gain momentum in FY27.
This, along with high dividends and profits from public sector enterprises, appear to be the much-needed fuel the government needs for its continued capex goals.
The capex mix
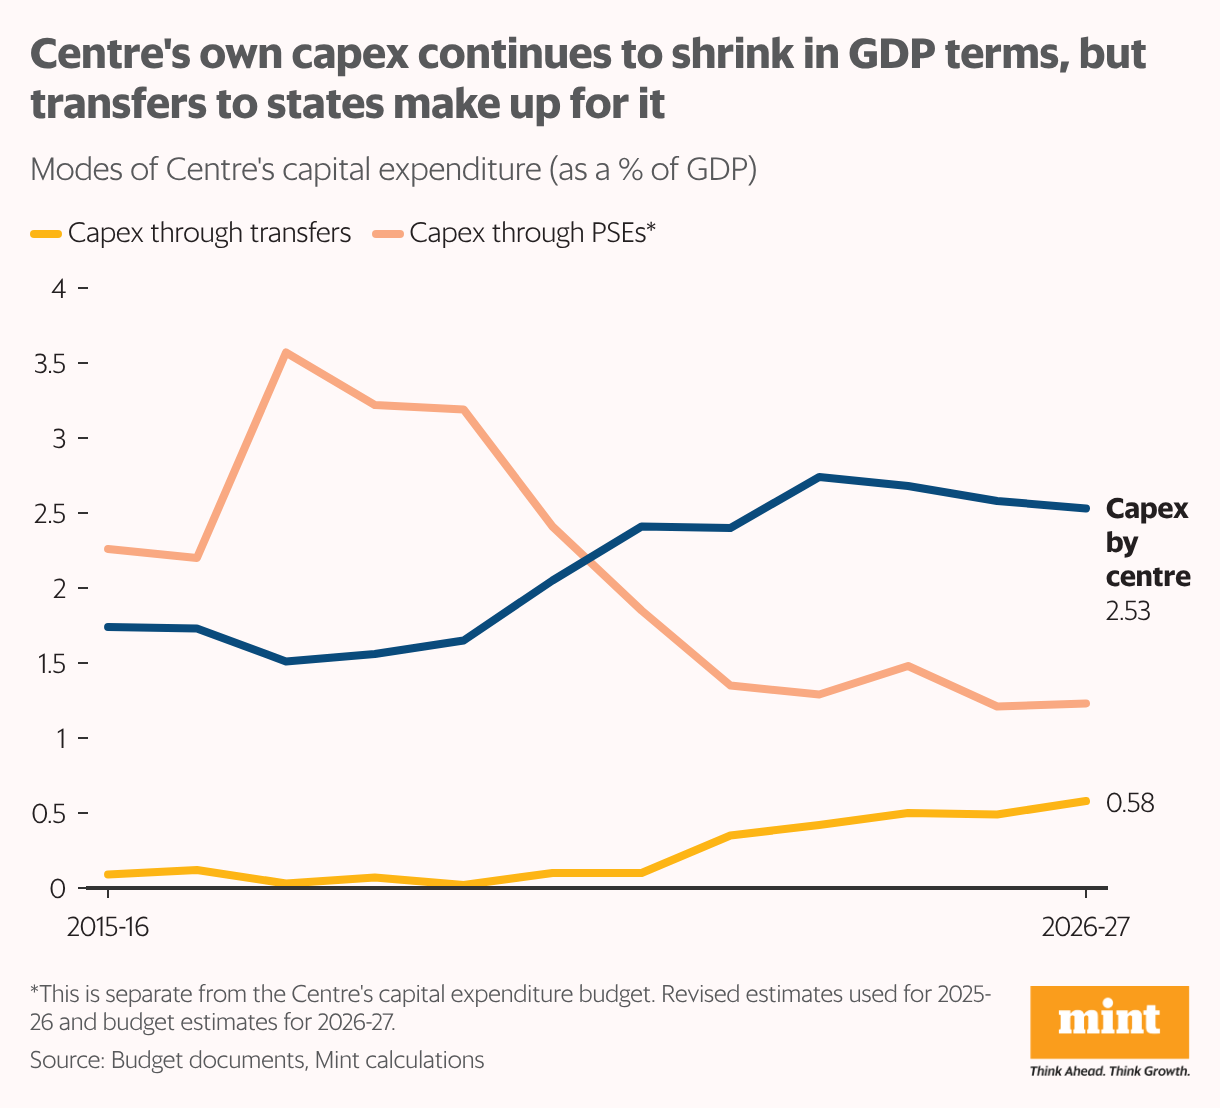
The budget has maintained its target for capital expenditure at 3.1% of GDP in FY27, which includes a growing focus on capex via transfers to states. However, the government has consistently missed its budgeted capex target in the last four years by 1.3-5.3%, which raises questions on whether it can meet its new target of ₹12.2 trillion for FY27.
While on one hand, capex through the Centre’s own budgetary resources is elevated, its impact has been limited by a sharp and continuous decline in capex through the resources of public enterprises (which is not part of the budget).
The return of welfare?
In the past few years, fiscal consolidation has come at the cost of welfare schemes and social sector spending. This year, despite constrained financials, the government seems to have taken some corrective measures, at least on paper.
The outlay on rural development is up 28% in FY27, accounting for 5.1% of total expenditure as against 4.3% in FY26. A large part of this push has come from spending on the rural jobs guarantee scheme (Mahatma Gandhi National Rural Employment Guarantee Act, or MGNREGA, and its upcoming version, Viksit Bharat – Guarantee for Rozgar and Ajeevika Mission Gramin), which is estimated to be ₹1.26 trillion. This is sharply up (nearly 43%) from the revised figure for FY26.
The sharp rise seems to have been made on account of the increased job guarantees from 100 days to 125 days per household under the upcoming scheme. Whether the entire outlay will get spent by the end of the year (which hasn’t been the case for MGNREGA for several years) hinges on two factors: one, jobs provided for a full 125 days (recent trends suggest about only 40-50 days) and two, states’ ability to match their share of 40% fiscal burden.
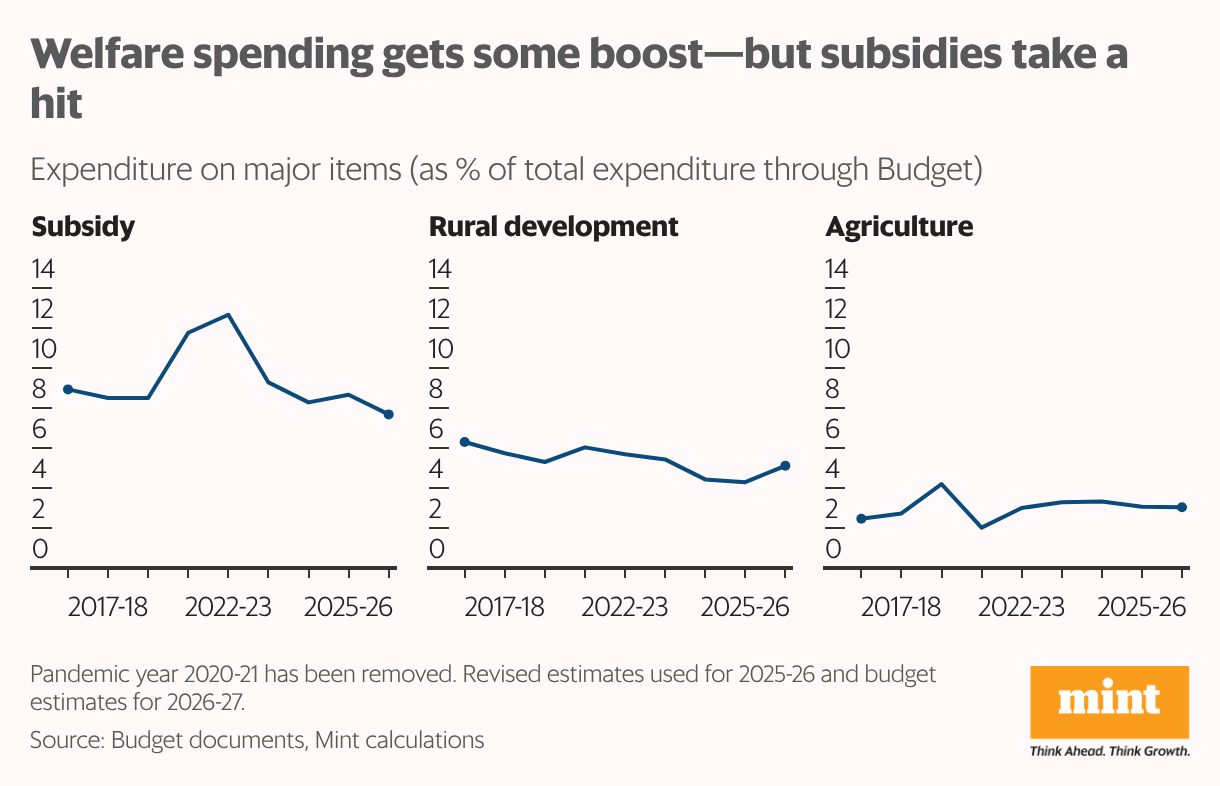
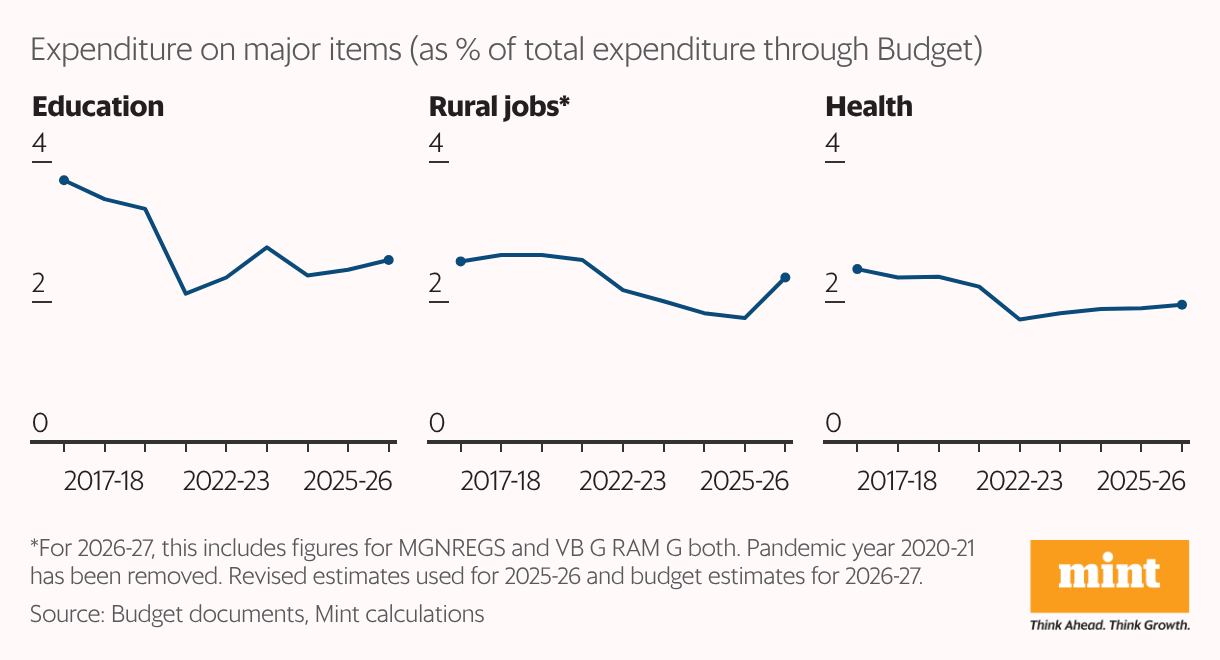
There has been an increase in health and education, too. Health spending is up by 10.5%, increasing its share in total spending to 1.96% from 1.91%. The education budget is up by 14.2%, taking its share higher by 15 bps to 2.6% of the total budget size. This has been balanced out by sharp cuts in spending on subsidies for fertilizer and cooking gas. But that may not be the last word: the government has a track record of surpassing its subsidy commitments more often than not. In fact, in FY26, the subsidy burden is expected to be nearly 10% more than what was initially budgeted.
Overall, the budget numbers show the government’s fast-shrinking room for higher expenditure. In that context, a revival in GDP growth, faster consumption and stronger momentum in tax collections are the need of the hour.