India’s economic momentum softened in September, as a sluggish external sector and weak consumer demand continued to weigh on overall performance, showed Mint’s macro tracker based on 16 high-frequency indicators.
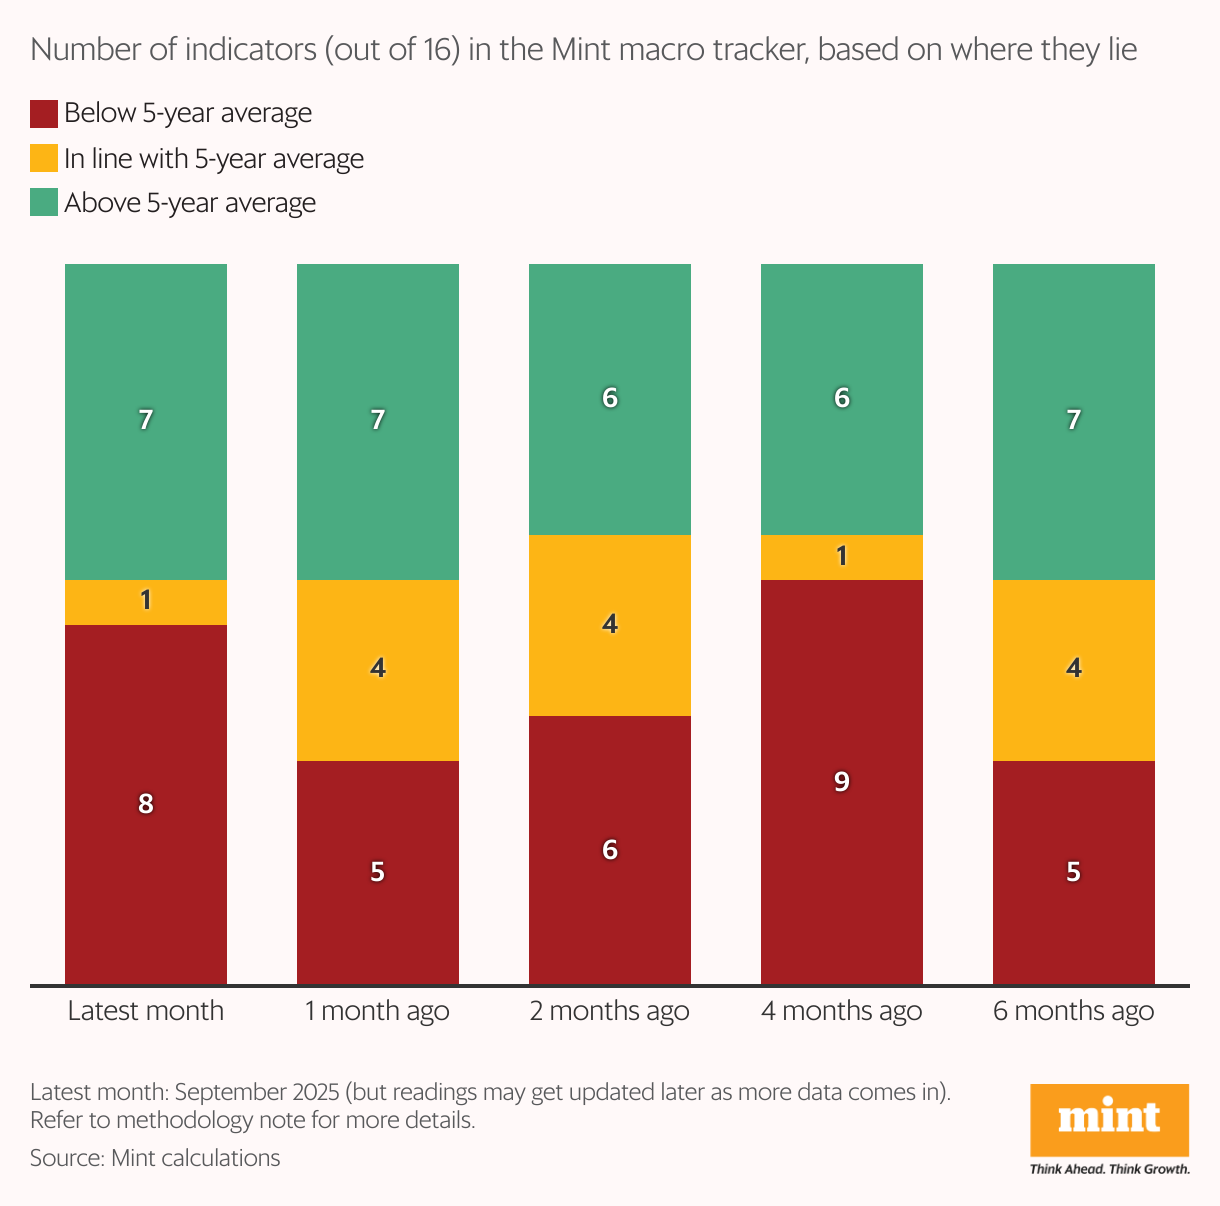
Of these, eight indicators were in the red, below their five-year average trend, compared to five in the previous month, reflecting a more uncertain global environment. Seven indicators remained in the green, unchanged from August, while the ease of living sector stayed strong on the back of low inflation. Three indicators – core sector growth, import cover, and labour-intensive sector exports – moved from amber to red.
The tracker, which compares each indicator to its five-year average, uses a colour code – green (better than average), amber (in line), and red (worse) – to offer a monthly snapshot of the economy’s pulse.
The consumer segment remained weighed down by the continued sluggishness in the broadband subscriber base and domestic air travel, both of which have stayed below their five-year averages for over a year. Passenger vehicle sales contracted 1% year-on-year, signalling another month of subdued urban demand despite some signs of improvement later in the month following goods and services tax (GST) cuts. Tractor sales, however, surged 45%, buoyed by a strong monsoon and improved farm sentiment.
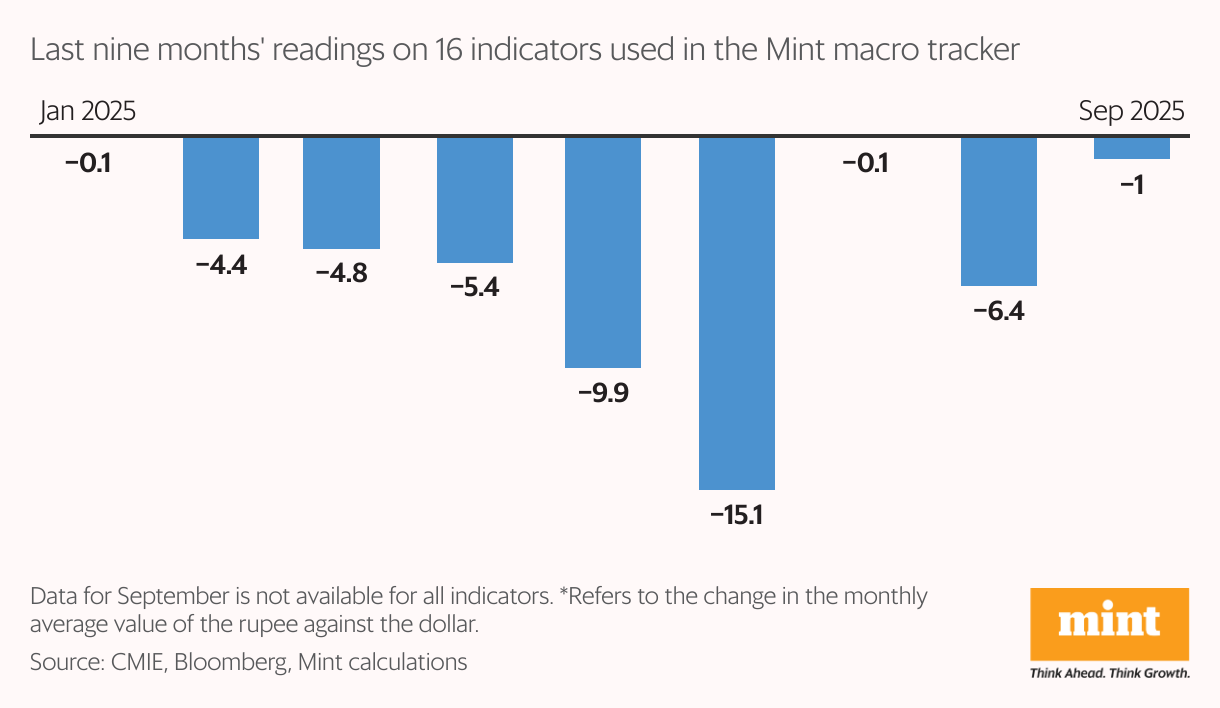
On the supply side, the economy maintained a steady momentum, but has yet to show any improvement. Two indicators – core growth and rail freight traffic – moved to the red zone. External conditions remained challenging. Labour-intensive exports fell 4.1% in September, extending a four-month slide, while the trade deficit widened to 30.6% of the total trade, the deepest level in six months. The rupee depreciated 0.7% against the dollar, although foreign exchange reserves continued to provide a comfortable 11.5 months of import cover.
Mint macro tracker, which provides a monthly comprehensive report on the state of the economy, based on trends in 16 high-frequency indicators. The tracker has been running since October 2018.
Methodology note: While calculating the five-year average, data for some indicators for April-May 2020 and April-May 2021 have been removed to eliminate lockdown-induced skews in the trend. However, the five-year averages may still show high figures due to sustained base effect in several indicators in 2021 and 2022.
Monthly standings will get updated retrospectively as more data comes in.
For inflation, the red/green coding is reversed.