With the base year updated to 2024 from 2012, the basket now comprises 358 items, redesigned to reflect contemporary consumption patterns. The headline retail inflation figure of 2.75% is broadly in line with recent readings under the old series, even as the underlying structures of measurement have shifted.
A first look at the data shows that most items saw low inflation, only a few categories recorded sharp price increases, and rural and urban inflation rates were broadly similar across most divisions. Here’s a breakdown of what the broader numbers show:
Inflation distribution
The item-level data under the new CPI series show that most prices rose at a modest pace in January 2026. An analysis of the 358 items in the basket indicates that nearly 60% lay outside the Reserve Bank of India’s (RBI’s) 2-6% target band—largely because a significant number recorded inflation below 2%, while a smaller group saw sharper increases.
As many as 61 items (17%) were in deflation, meaning prices fell compared to a year ago. Another 49 items (13.7%) recorded inflation between 0-1%. A further 64 items (17.9%) were in the 1-2% range and 76 items (21.2%) in the 2-3% band, making this the largest cluster. Together, this means over half the basket saw inflation below 3%.
At the higher end, only 40 items (11.2%) posted inflation above 6%, and just seven items were in the 5-6% bracket. The data shows that price pressures were limited to a relatively small set of goods. For most items in the CPI basket, inflation remained low and contained.
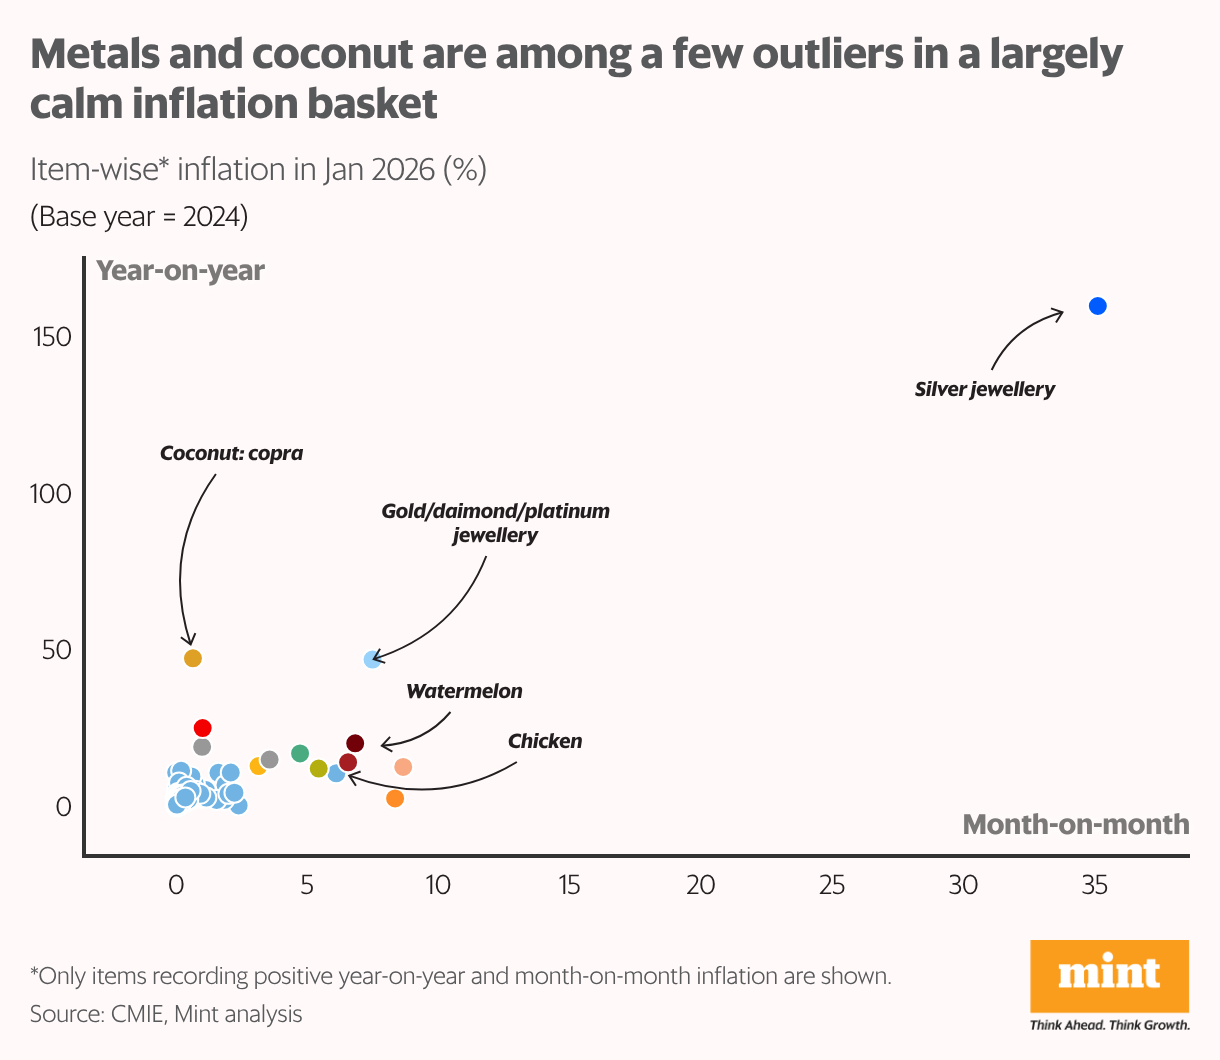
Isolated pressures
Even as most items saw modest price changes, a small set recorded high inflation during the month. Precious metals stood out: silver jewellery prices rose nearly 160% year-on-year, while gold and other jewellery items saw increases of over 45%.
Among food items, tomato prices were up nearly 65%, and products linked to coconut—including copra and coconut oil—recorded inflation above 40%. Several vegetables such as cauliflower and brinjal also posted double-digit increases. However, many of these items carry relatively small weights in the overall basket. Their sharp price movements therefore had a limited impact on the headline number.
At the same time, several widely consumed food staples were in deflation. Garlic recorded inflation of -53%, while onion and potato were close to -29% each. Arhar (tur) was also in deflation at nearly -25%. These items carry meaningful weights in household consumption, particularly in rural India, making their price movements significant for the overall index.
Taken together, the data shows that January’s inflation print was shaped by offsetting extremes—sharp spikes in a few items alongside deep deflation in others—rather than uniform price pressures across categories.
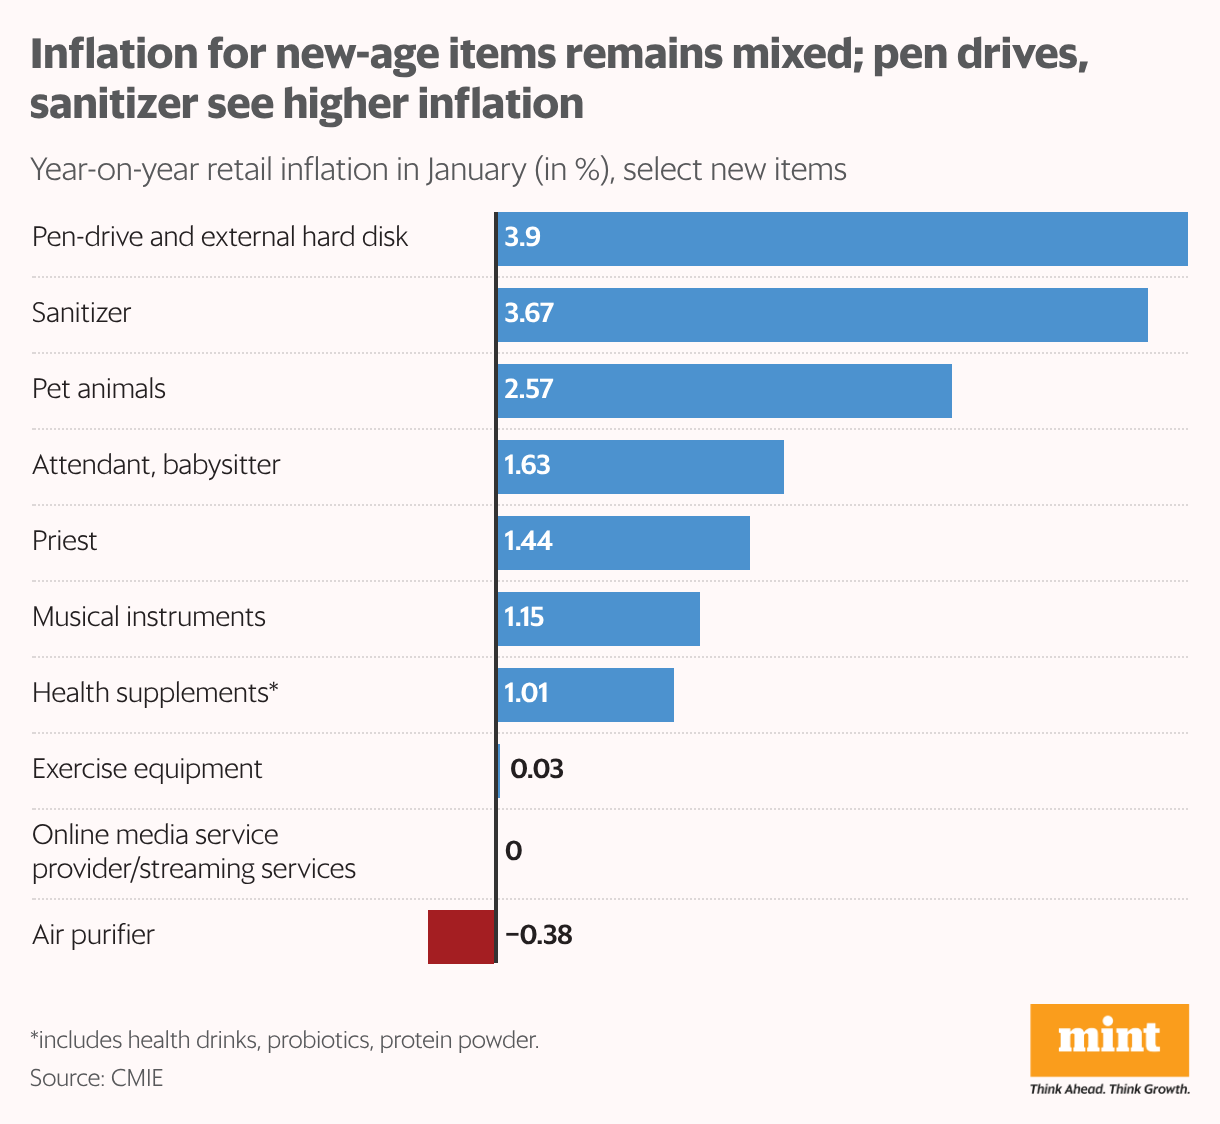
The new basket
The shift to the 2024 base year has refreshed the CPI basket with new items reflecting modern household budgets. These additions—ranging from digital storage and streaming services to health supplements and personal services like priests and attendants—aim to fill gaps in the previous series.
Initial data for January shows that price levels for these new entrants are largely modest. For instance, inflation for pen-drives and external hard disks stood at 3.9%, while sanitizers were recorded at 3.67%. Price growth for pet animals was 2.57%, while services for attendants and priests hovered between 1% and 2%. Health supplements (1.01%) and exercise equipment (0.1%) showed minimal movement. Meanwhile, streaming services saw no price change, and air purifiers recorded a slight dip.
Crucially, most of these new items carry negligible weights—often below 0.05%—limiting their influence on the headline number. Their inclusion is less about moving the needle on current inflation and more about accurately tracking the changing anatomy of Indian consumption. Since this is the first month of the new series, these figures establish a fresh benchmark for future comparisons.
State-level patterns
The state-level data, under the new CPI series, points to a tighter clustering of inflation rates around the national average. While differences across states remain, the deviation appears narrower than in parts of the earlier series. Few states stand out as outliers, while most lie within a relatively contained band around the all-India figure. This suggests that the revised basket and updated weights may be capturing regional consumption patterns more evenly.
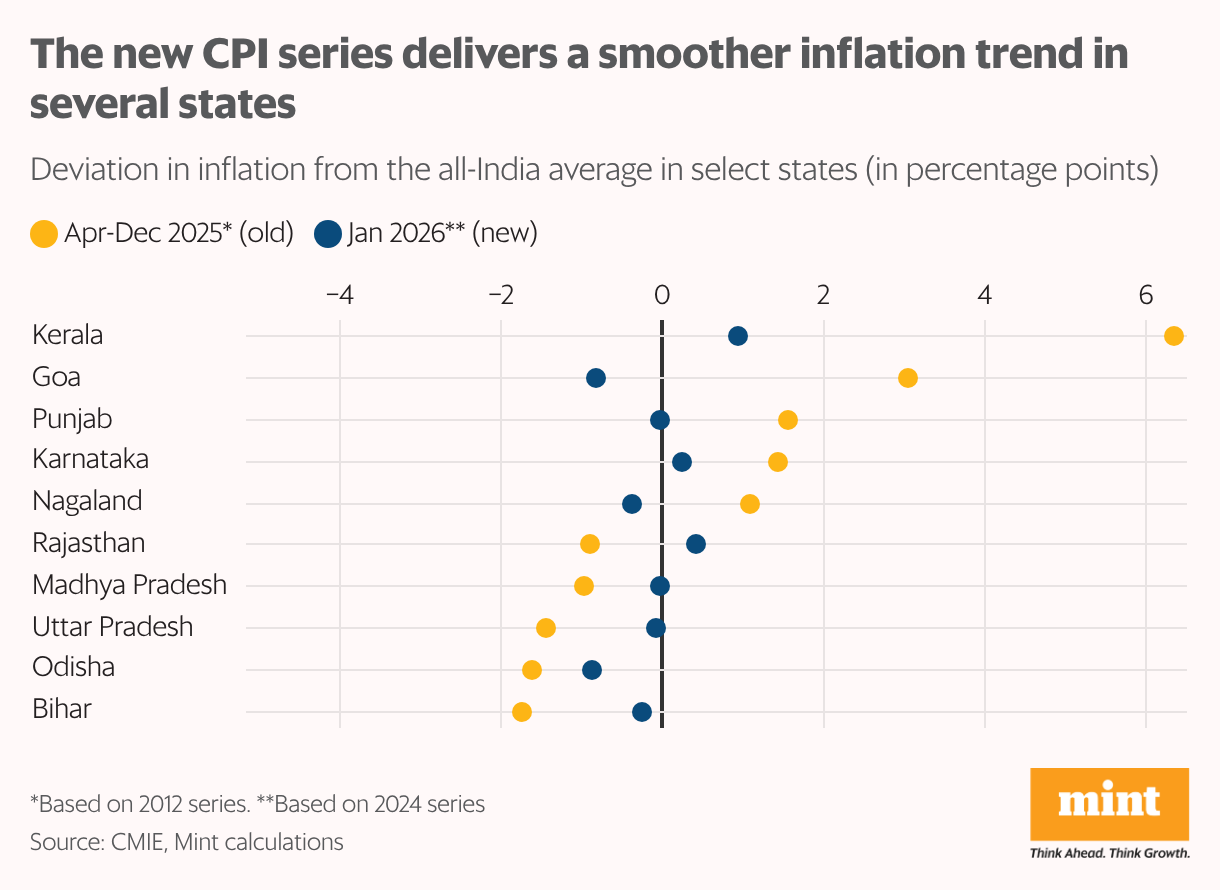
Under the previous base year, state inflation readings often showed sharper swings, partly due to older weights and narrower item coverage. With the 2024 base, price movements across states appear more aligned, indicating that common consumption items now carry weights that better reflect current spending behaviour.
That does not mean regional differences have disappeared. Variations in food prices, local supply conditions and services still shape state outcomes. However, the new series appears to reduce distortions that can arise from outdated structures. For policymakers, a more comparable state-level series improves the reliability of cross-state assessments and strengthens the basis for region-specific interventions without overstating volatility.
The rural-urban divide
Across high-weight divisions, the spread between rural and urban readings remains limited, indicating that households in both segments faced broadly similar cost conditions. Food and beverages—the single largest component in rural consumption—did not diverge sharply from urban prints. This matters because food has historically been the main driver of rural–urban inflation gaps.
The most elevated inflation was recorded in personal care and miscellaneous goods and services, and notably, it was high in both rural (19.59%) and urban (18.28%) areas. The similarity of these readings points to pricing factors—possibly linked to services or regulated components—rather than local supply disruptions.
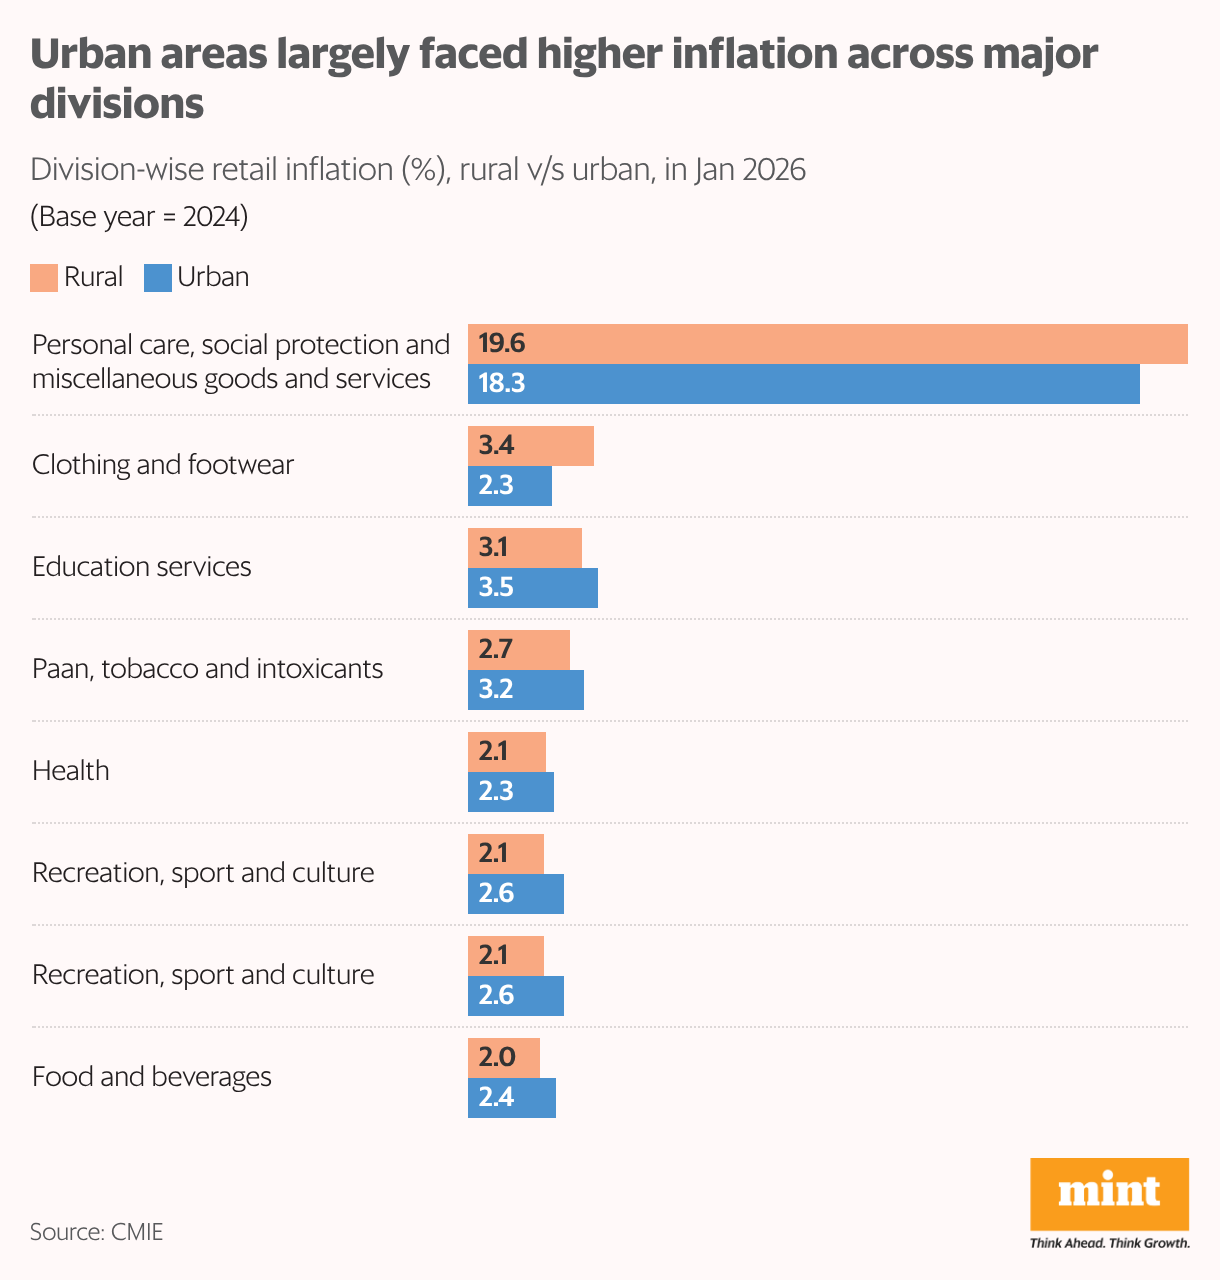
Where differences do appear, such as in clothing (3.4% rural versus 2.29% urban) or education services (3.08% rural versus 3.53% urban), they are moderate and consistent.
Historically, rural and urban baskets have moved differently because of distinct consumption weights. The revised base appears to moderate these structural gaps, resulting in a more integrated inflation profile.